Uncertainty assessment
The IPCC guidelines provide information on taking into account uncertainty.
The bonsai_ipcc package implements those by allowing the user to do analytical error propagation and Monte Carlo simualtion when running a tier sequence.
To use one of the approaches, each parameter involved in a sequence requires information about its uncertainty. This information is specifeid by the properties “def” , “min”, “max”, “abs_min” and “abs_max” (mean, 2.5 percentile, 97.5 percentile, absolute minimum, absolute maximum) in the parameter table.
Let´s use have a look into the waste incineration example.
Add data with uncertainty
As already done in the previous tutorial for running a sequence, we need to add the data which is not provided by the package. So let´s do this again.
import bonsai_ipcc
import pandas as pd
import numpy as np

my_ipcc = bonsai_ipcc.IPCC()

# urban population
d = {
    "year": [2010,2010,2010,2010,2010],
    "region": ["DE","DE","DE","DE","DE"],
    "property": [
        "def","min","max","abs_min","abs_max"
    ],
    "value": [
        62940432.0,61996325.52,63884538.48,0.0,np.inf,
    ],
    "unit": [
    "cap/yr","cap/yr","cap/yr","cap/yr","cap/yr",
    ],
}
urb_pop = pd.DataFrame(d).set_index(["year", "region", "property"])

my_ipcc.waste.incineration.parameter.urb_population=urb_pop
---------------------------------------------------------------------------
KeyboardInterrupt                         Traceback (most recent call last)
Cell In[1], line 1
----> 1 import bonsai_ipcc
      2 import pandas as pd
      3 import numpy as np

File /builds/bonsamurais/bonsai/util/ipcc/.tox/docs/lib/python3.12/site-packages/bonsai_ipcc/__init__.py:9
      6 from os.path import dirname
      7 from pathlib import Path
----> 9 from .core import IPCC, PPF
     10 from .log_setup import setup_logger
     12 # setup the default logger

File /builds/bonsamurais/bonsai/util/ipcc/.tox/docs/lib/python3.12/site-packages/bonsai_ipcc/core.py:8
      5 import pandas as pd
      6 import yaml
----> 8 from . import agriculture, industry, ppf, waste
      9 from ._metadata import MetaData  # TODO
     10 from .sample import create_sample

File /builds/bonsamurais/bonsai/util/ipcc/.tox/docs/lib/python3.12/site-packages/bonsai_ipcc/waste/__init__.py:1
----> 1 from . import biological, incineration, swd, waste_generation, wastewater

File /builds/bonsamurais/bonsai/util/ipcc/.tox/docs/lib/python3.12/site-packages/bonsai_ipcc/waste/biological/__init__.py:1
----> 1 from . import elementary, sequence
      2 from ._data import concordance, dimension, parameter

File /builds/bonsamurais/bonsai/util/ipcc/.tox/docs/lib/python3.12/site-packages/bonsai_ipcc/waste/biological/sequence.py:16
     14 from ..._sequence import Sequence
     15 from . import elementary as elem
---> 16 from ._data import concordance as conc
     17 from ._data import dimension as dim
     18 from ._data import parameter as par

File /builds/bonsamurais/bonsai/util/ipcc/.tox/docs/lib/python3.12/site-packages/bonsai_ipcc/waste/biological/_data.py:3
      1 from ..._data import Concordance, Dimension, Parameter
----> 3 dimension = Dimension("data/", activitycode="biological", productcode="waste")
      5 parameter = Parameter(["data/waste/biological/", "data/waste/waste_generation/"])
      7 concordance = Concordance("data/")

File /builds/bonsamurais/bonsai/util/ipcc/.tox/docs/lib/python3.12/site-packages/bonsai_ipcc/_data.py:40, in Dimension.__init__(self, path_in, activitycode, productcode)
     38         df = self._filter_dataframe(df, activitycode)
     39     elif filename == "dim_product.csv":
---> 40         df = self._filter_dataframe(df, productcode)
     41     setattr(self, filename[4:-4], df)
     42 except Exception:
     43     # print(f"error reading {filename}")

File /builds/bonsamurais/bonsai/util/ipcc/.tox/docs/lib/python3.12/site-packages/bonsai_ipcc/_data.py:56, in Dimension._filter_dataframe(self, df, code)
     54         child_codes.append(index)
     55         # Recursively call the function to find child codes of this child code
---> 56         child_codes.extend(self._filter_dataframe(df, index).index.tolist())
     58 # Filter the DataFrame to include all child codes found
     59 filtered_df = df.loc[child_codes]

File /builds/bonsamurais/bonsai/util/ipcc/.tox/docs/lib/python3.12/site-packages/bonsai_ipcc/_data.py:51, in Dimension._filter_dataframe(self, df, code)
     48 child_codes = []
     50 # Iterate through the index of the DataFrame to find child codes
---> 51 for index, row in df.iterrows():
     52     if row["parent_code"] == code:
     53         # Add the child code to the list
     54         child_codes.append(index)

File /builds/bonsamurais/bonsai/util/ipcc/.tox/docs/lib/python3.12/site-packages/pandas/core/frame.py:1559, in DataFrame.iterrows(self)
   1557 using_cow = using_copy_on_write()
   1558 for k, v in zip(self.index, self.values):
-> 1559     s = klass(v, index=columns, name=k).__finalize__(self)
   1560     if using_cow and self._mgr.is_single_block:
   1561         s._mgr.add_references(self._mgr)  # type: ignore[arg-type]

File /builds/bonsamurais/bonsai/util/ipcc/.tox/docs/lib/python3.12/site-packages/pandas/core/series.py:588, in Series.__init__(self, data, index, dtype, name, copy, fastpath)
    586 manager = _get_option("mode.data_manager", silent=True)
    587 if manager == "block":
--> 588     data = SingleBlockManager.from_array(data, index, refs=refs)
    589 elif manager == "array":
    590     data = SingleArrayManager.from_array(data, index)

File /builds/bonsamurais/bonsai/util/ipcc/.tox/docs/lib/python3.12/site-packages/pandas/core/internals/managers.py:1870, in SingleBlockManager.from_array(cls, array, index, refs)
   1863 @classmethod
   1864 def from_array(
   1865     cls, array: ArrayLike, index: Index, refs: BlockValuesRefs | None = None
   1866 ) -> SingleBlockManager:
   1867     """
   1868     Constructor for if we have an array that is not yet a Block.
   1869     """
-> 1870     array = maybe_coerce_values(array)
   1871     bp = BlockPlacement(slice(0, len(index)))
   1872     block = new_block(array, placement=bp, ndim=1, refs=refs)

File /builds/bonsamurais/bonsai/util/ipcc/.tox/docs/lib/python3.12/site-packages/pandas/core/internals/blocks.py:2718, in maybe_coerce_values(values)
   2711     __slots__ = ()
   2714 # -----------------------------------------------------------------
   2715 # Constructor Helpers
-> 2718 def maybe_coerce_values(values: ArrayLike) -> ArrayLike:
   2719     """
   2720     Input validation for values passed to __init__. Ensure that
   2721     any datetime64/timedelta64 dtypes are in nanoseconds.  Ensure
   (...)   2730     values : np.ndarray or ExtensionArray
   2731     """
   2732     # Caller is responsible for ensuring NumpyExtensionArray is already extracted.

KeyboardInterrupt:
To take the uncertainty into account, we need to add the values for def, min, max, abs_min, and abs_max. A description of the property dimension can be found here:
my_ipcc.waste.incineration.dimension.property
| description | remarks | |
|---|---|---|
| code | ||
| def | default | mean |
| min | minimum | 2.5th percentile |
| max | maximum | 97.5th percentile |
| abs_max | absolute maximun | theoretical upper bound |
| abs_min | absolute minimum | theoretical lower bound |
| dummy | place holder for emtpy tables | NaN |
Monte Carlo simulation
To run the sequence as Monte Carlo simulation you can use monte_carlo as keyword. Notably, the ipcc package uses a vectorized way of iplmenting Monte Carlo simulation. Thus, all parameters for those uncertainty information is included in the parameter tables and all calculated results are represented as numpy arrays (1000 values).
We use the incineration example again, but chose the paper fraction of municipal waste instead of plastics.
# run the sequence
my_tier = my_ipcc.waste.incineration.sequence.tier1_co2(year=2010, region="DE", wastetype= "msw_paper", incintype= "inc_unspecified", uncertainty="monte_carlo")
s = my_tier.to_dict()
2023-12-19 15:35:42,594 - INFO - Incineration sequence started --->
2023-12-19 15:35:42,595 - INFO - Uncertainty distribution for parameter 'urb_population':
2023-12-19 15:35:42,595 - INFO - lognormal distribution
/Users/TN76JP/Documents/coderefinery/ipcc/ipcc/src/ipcc/_sequence.py:87: FutureWarning: Series.__getitem__ treating keys as positions is deprecated. In a future version, integer keys will always be treated as labels (consistent with DataFrame behavior). To access a value by position, use `ser.iloc[pos]`
  new_c = conc_df.loc[c][j]
2023-12-19 15:35:42,598 - INFO - Uncertainty distribution for parameter 'msw_gen_rate':
2023-12-19 15:35:42,598 - INFO - lognormal distribution
2023-12-19 15:35:42,598 - INFO - 'Coordinates (2010, 'DE')' has been replaced by '[2006, 'Western Europe']' during reading parameter table 'msw_gen_rate'
2023-12-19 15:35:42,599 - INFO - Uncertainty distribution for parameter 'msw_frac_to_incin':
2023-12-19 15:35:42,600 - INFO - normal distribution, lower uncertainty
2023-12-19 15:35:42,600 - INFO - 'Coordinates (2010, 'DE')' has been replaced by '[2006, 'Western Europe']' during reading parameter table 'msw_frac_to_incin'
2023-12-19 15:35:42,602 - INFO - Uncertainty distribution for parameter 'msw_type_frac':
2023-12-19 15:35:42,603 - INFO - normal distribution, lower uncertainty
2023-12-19 15:35:42,603 - INFO - 'Coordinates (2010, 'DE', 'msw_paper')' has been replaced by '[2006, 'DE', 'msw_paper']' during reading parameter table 'msw_type_frac'
2023-12-19 15:35:42,605 - INFO - Uncertainty distribution for parameter 'incintype_frac':
/Users/TN76JP/Documents/coderefinery/ipcc/ipcc/src/ipcc/uncertainties.py:295: RuntimeWarning: invalid value encountered in double_scalars
  if max(sd / (mean - abs_min), sd / (abs_max - mean)) <= 0.3:
2023-12-19 15:35:42,606 - INFO - normal distribution, lower uncertainty
2023-12-19 15:35:42,606 - INFO - 'Coordinates (2010, 'DE', 'inc_unspecified')' has been replaced by '[2006, 'World', 'inc_unspecified']' during reading parameter table 'incintype_frac'
2023-12-19 15:35:42,609 - INFO - Uncertainty distribution for parameter 'dm':
2023-12-19 15:35:42,609 - INFO - truncated normal distribution with adjusting based on Rodriques 2015 (moderate)
2023-12-19 15:35:42,611 - INFO - 'Coordinates (2010, 'DE', 'msw_paper')' has been replaced by '[2006, 'World', 'msw_paper']' during reading parameter table 'dm'
2023-12-19 15:35:42,612 - INFO - Uncertainty distribution for parameter 'cf':
2023-12-19 15:35:42,613 - INFO - normal distribution, lower uncertainty
2023-12-19 15:35:42,613 - INFO - 'Coordinates (2010, 'DE', 'msw_paper')' has been replaced by '[2006, 'World', 'msw_paper']' during reading parameter table 'cf'
2023-12-19 15:35:42,614 - INFO - Uncertainty distribution for parameter 'fcf':
2023-12-19 15:35:42,614 - INFO - truncated normal distribution with adjusting based on Rodriques 2015 (moderate)
2023-12-19 15:35:42,615 - INFO - 'Coordinates ('DE', 'msw_paper', 'inc_unspecified')' has been replaced by '['World', 'msw_paper', 'inc_unspecified']' during reading parameter table 'fcf'
2023-12-19 15:35:42,616 - INFO - Uncertainty distribution for parameter 'of':
2023-12-19 15:35:42,616 - INFO - normal distribution, lower uncertainty
2023-12-19 15:35:42,617 - INFO - 'Coordinates ('DE', 'msw_paper', 'inc_unspecified')' has been replaced by '['World', 'msw_paper', 'inc_unspecified']' during reading parameter table 'of'
2023-12-19 15:35:42,617 - INFO - ---> Incineration sequence finalized.
# check the last step (emissions)
type(s["co2_emissions"].value)
numpy.ndarray
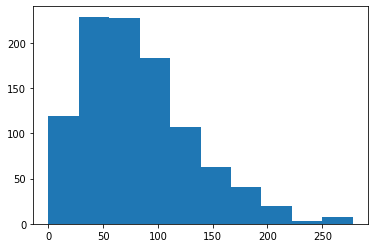
Plot the results
# plot the emissions
import matplotlib.pyplot as plt

plt.hist(my_tier.co2_emissions.value)
(array([119., 229., 228., 183., 107.,  63.,  41.,  20.,   3.,   7.]),
 array([1.02748936e-01, 2.78783377e+01, 5.56539265e+01, 8.34295153e+01,
        1.11205104e+02, 1.38980693e+02, 1.66756282e+02, 1.94531871e+02,
        2.22307459e+02, 2.50083048e+02, 2.77858637e+02]),
 <BarContainer object of 10 artists>)
Analytical error propagation
Another method that is implemented in the ipcc package is analytical error propgation. The keyword analytical can be used in this case. The implementation is done using the uncertainties Python package. Thus all results are of type ufloat.
final_step = my_ipcc.waste.incineration.sequence.tier1_co2(year=2010, region="DE", wastetype= "msw_paper", incintype= "inc_unspecified", uncertainty="analytical").co2_emissions
final_step
2023-12-19 15:35:43,008 - INFO - Incineration sequence started --->
/Users/TN76JP/Documents/coderefinery/ipcc/ipcc/src/ipcc/_sequence.py:87: FutureWarning: Series.__getitem__ treating keys as positions is deprecated. In a future version, integer keys will always be treated as labels (consistent with DataFrame behavior). To access a value by position, use `ser.iloc[pos]`
  new_c = conc_df.loc[c][j]
2023-12-19 15:35:43,010 - INFO - 'Coordinates (2010, 'DE')' has been replaced by '[2006, 'Western Europe']' during reading parameter table 'msw_gen_rate'
2023-12-19 15:35:43,011 - INFO - 'Coordinates (2010, 'DE')' has been replaced by '[2006, 'Western Europe']' during reading parameter table 'msw_frac_to_incin'
2023-12-19 15:35:43,013 - INFO - 'Coordinates (2010, 'DE', 'msw_paper')' has been replaced by '[2006, 'DE', 'msw_paper']' during reading parameter table 'msw_type_frac'
2023-12-19 15:35:43,015 - INFO - 'Coordinates (2010, 'DE', 'inc_unspecified')' has been replaced by '[2006, 'World', 'inc_unspecified']' during reading parameter table 'incintype_frac'
2023-12-19 15:35:43,017 - INFO - 'Coordinates (2010, 'DE', 'msw_paper')' has been replaced by '[2006, 'World', 'msw_paper']' during reading parameter table 'dm'
2023-12-19 15:35:43,019 - INFO - 'Coordinates (2010, 'DE', 'msw_paper')' has been replaced by '[2006, 'World', 'msw_paper']' during reading parameter table 'cf'
2023-12-19 15:35:43,020 - INFO - 'Coordinates ('DE', 'msw_paper', 'inc_unspecified')' has been replaced by '['World', 'msw_paper', 'inc_unspecified']' during reading parameter table 'fcf'
2023-12-19 15:35:43,020 - INFO - 'Coordinates ('DE', 'msw_paper', 'inc_unspecified')' has been replaced by '['World', 'msw_paper', 'inc_unspecified']' during reading parameter table 'of'
2023-12-19 15:35:43,021 - INFO - ---> Incineration sequence finalized.
Step(position=12, year=2010, unit='Gg/year', value=88.4667825477414+/-52.63985799388056, type='elementary')
Plot the results
import scipy.stats as stats

mu = final_step.value.n
sigma = final_step.value.std_dev
x = np.linspace(mu - 3*sigma, mu + 3*sigma, 100)
plt.plot(x, stats.norm.pdf(x, mu, sigma))
[<matplotlib.lines.Line2D at 0x289602620>]
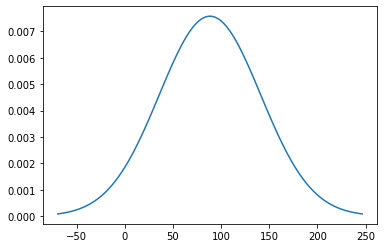
What can we learn?
In this example, the values can be negative when using analytical error propagation. This is due to the high uncertainties in the data, using the tier 1 approach. However, it does not make sense to have negative CO2 emissions! Thus, Monte Carlo simulation should be used rather than analytical error propagation which is suitable for lower uncertainties.